
Dashboard
Your platform overview — composite score, industry benchmarking and your hubs.
Dashboard is the first page you see after signing in: Welcome back and Here's what's happening across your organisation today.
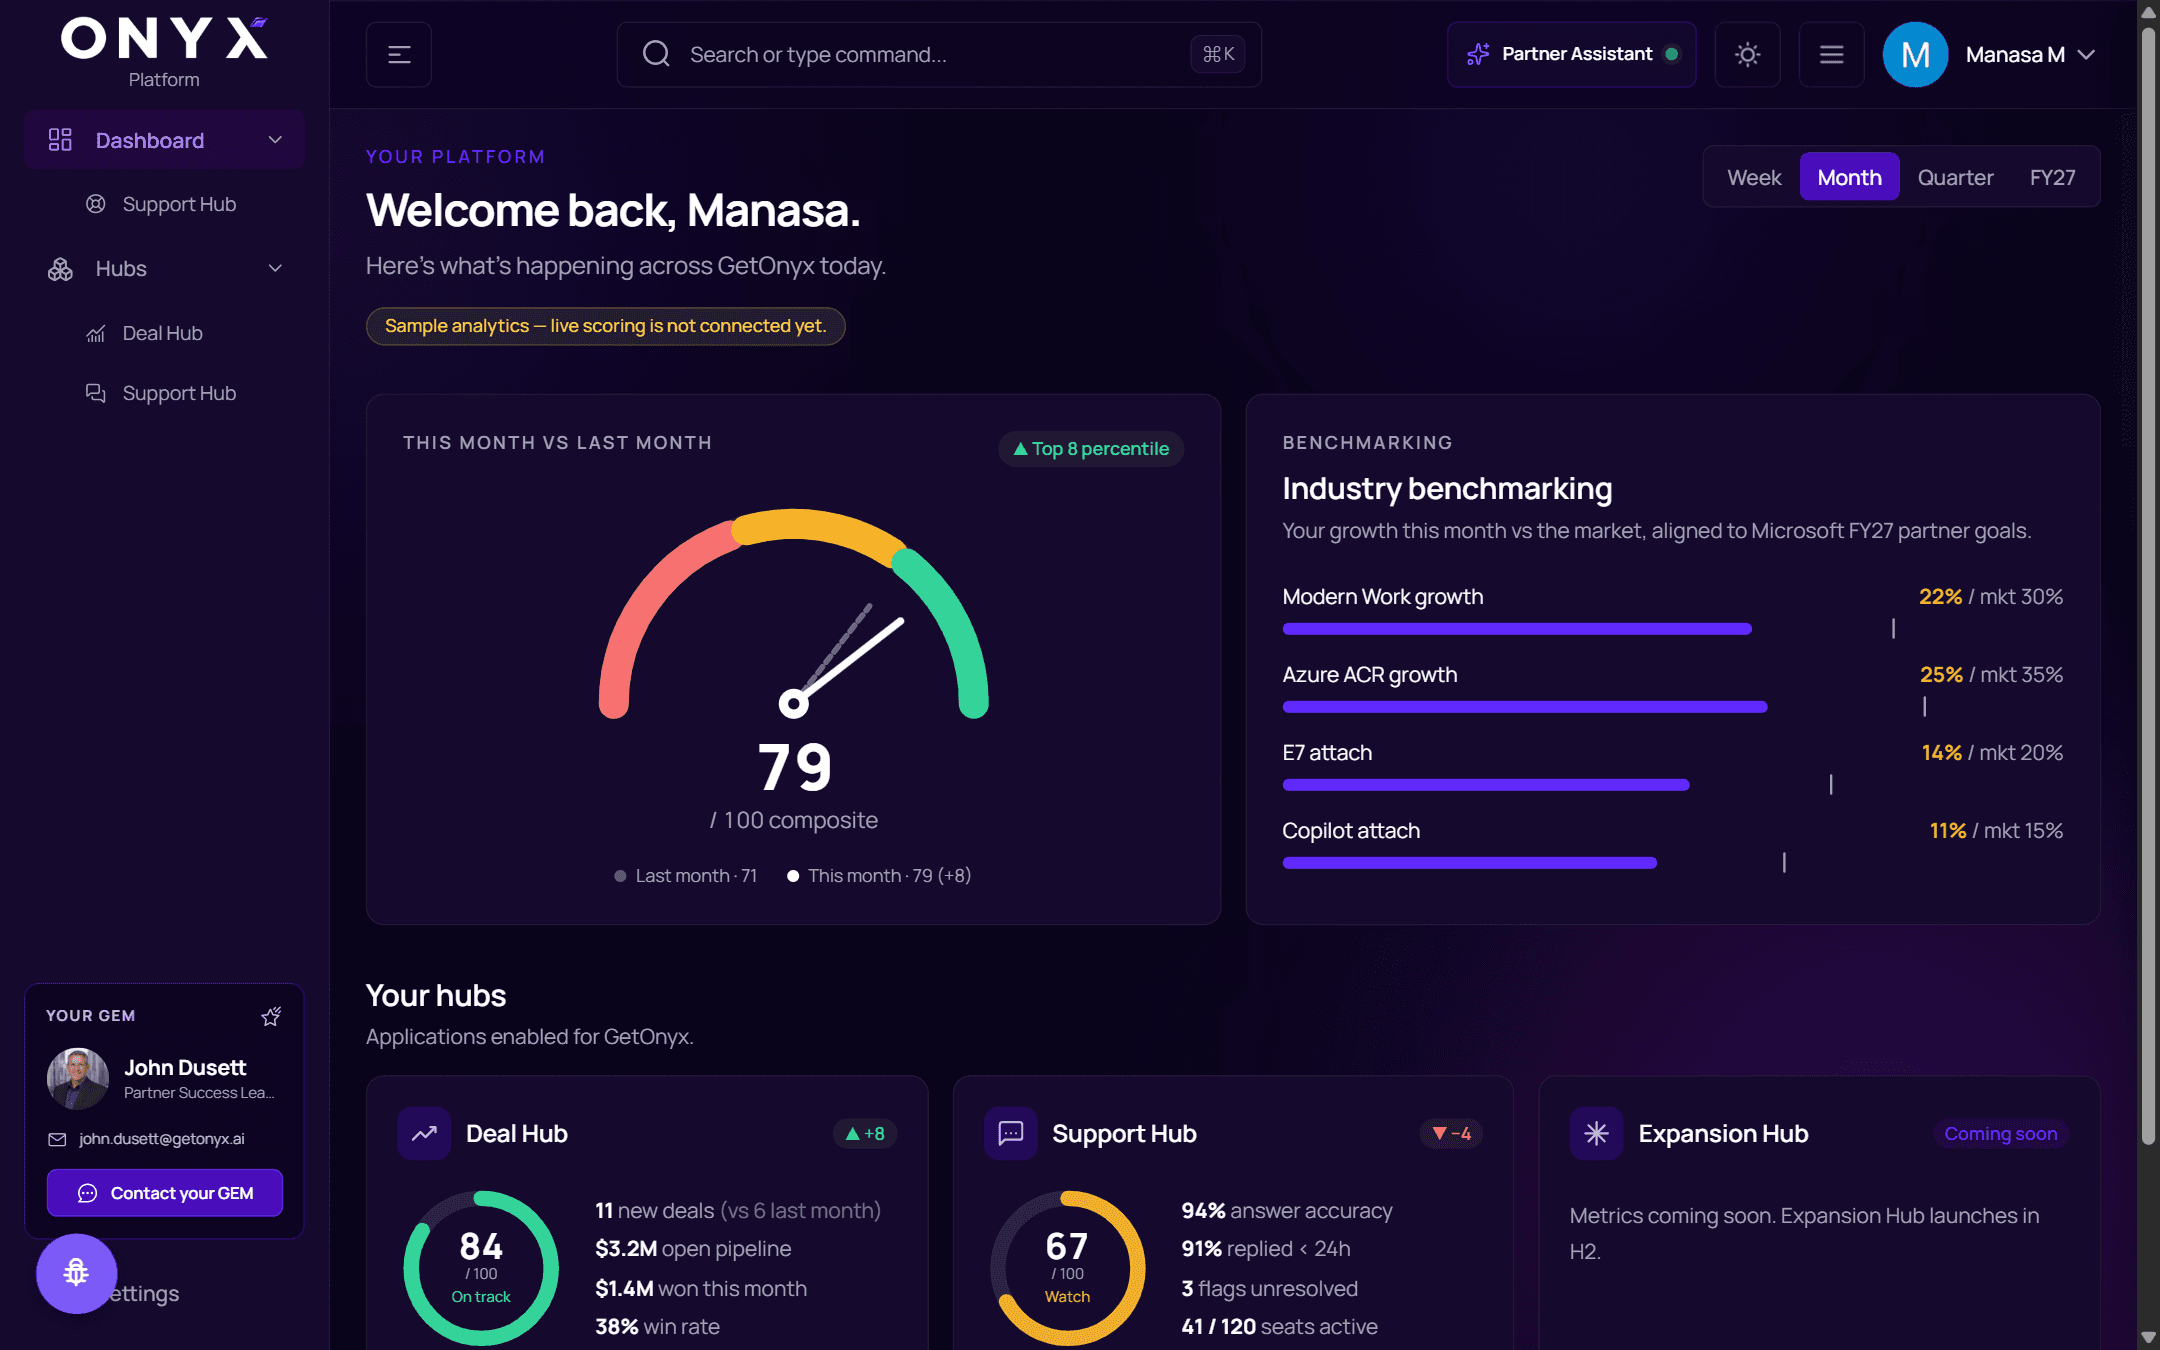
Sample analytics
The dashboard currently shows sample analytics — live scoring is not connected yet. Treat the figures as an illustration of what the dashboard will show, not as your real results.
Choose the period at the top right: Week, Month, Quarter or FY27.
This month vs last month
A gauge shows your composite score out of 100, this period against the last, with your percentile.
Industry benchmarking
Your growth this month vs the market, aligned to Microsoft FY27 partner goals — for example Modern Work growth, Azure ACR growth, E7 attach and Copilot attach — each with your figure and the market figure (mkt).
Your hubs
Applications enabled for your organisation, each with its own score and highlights.
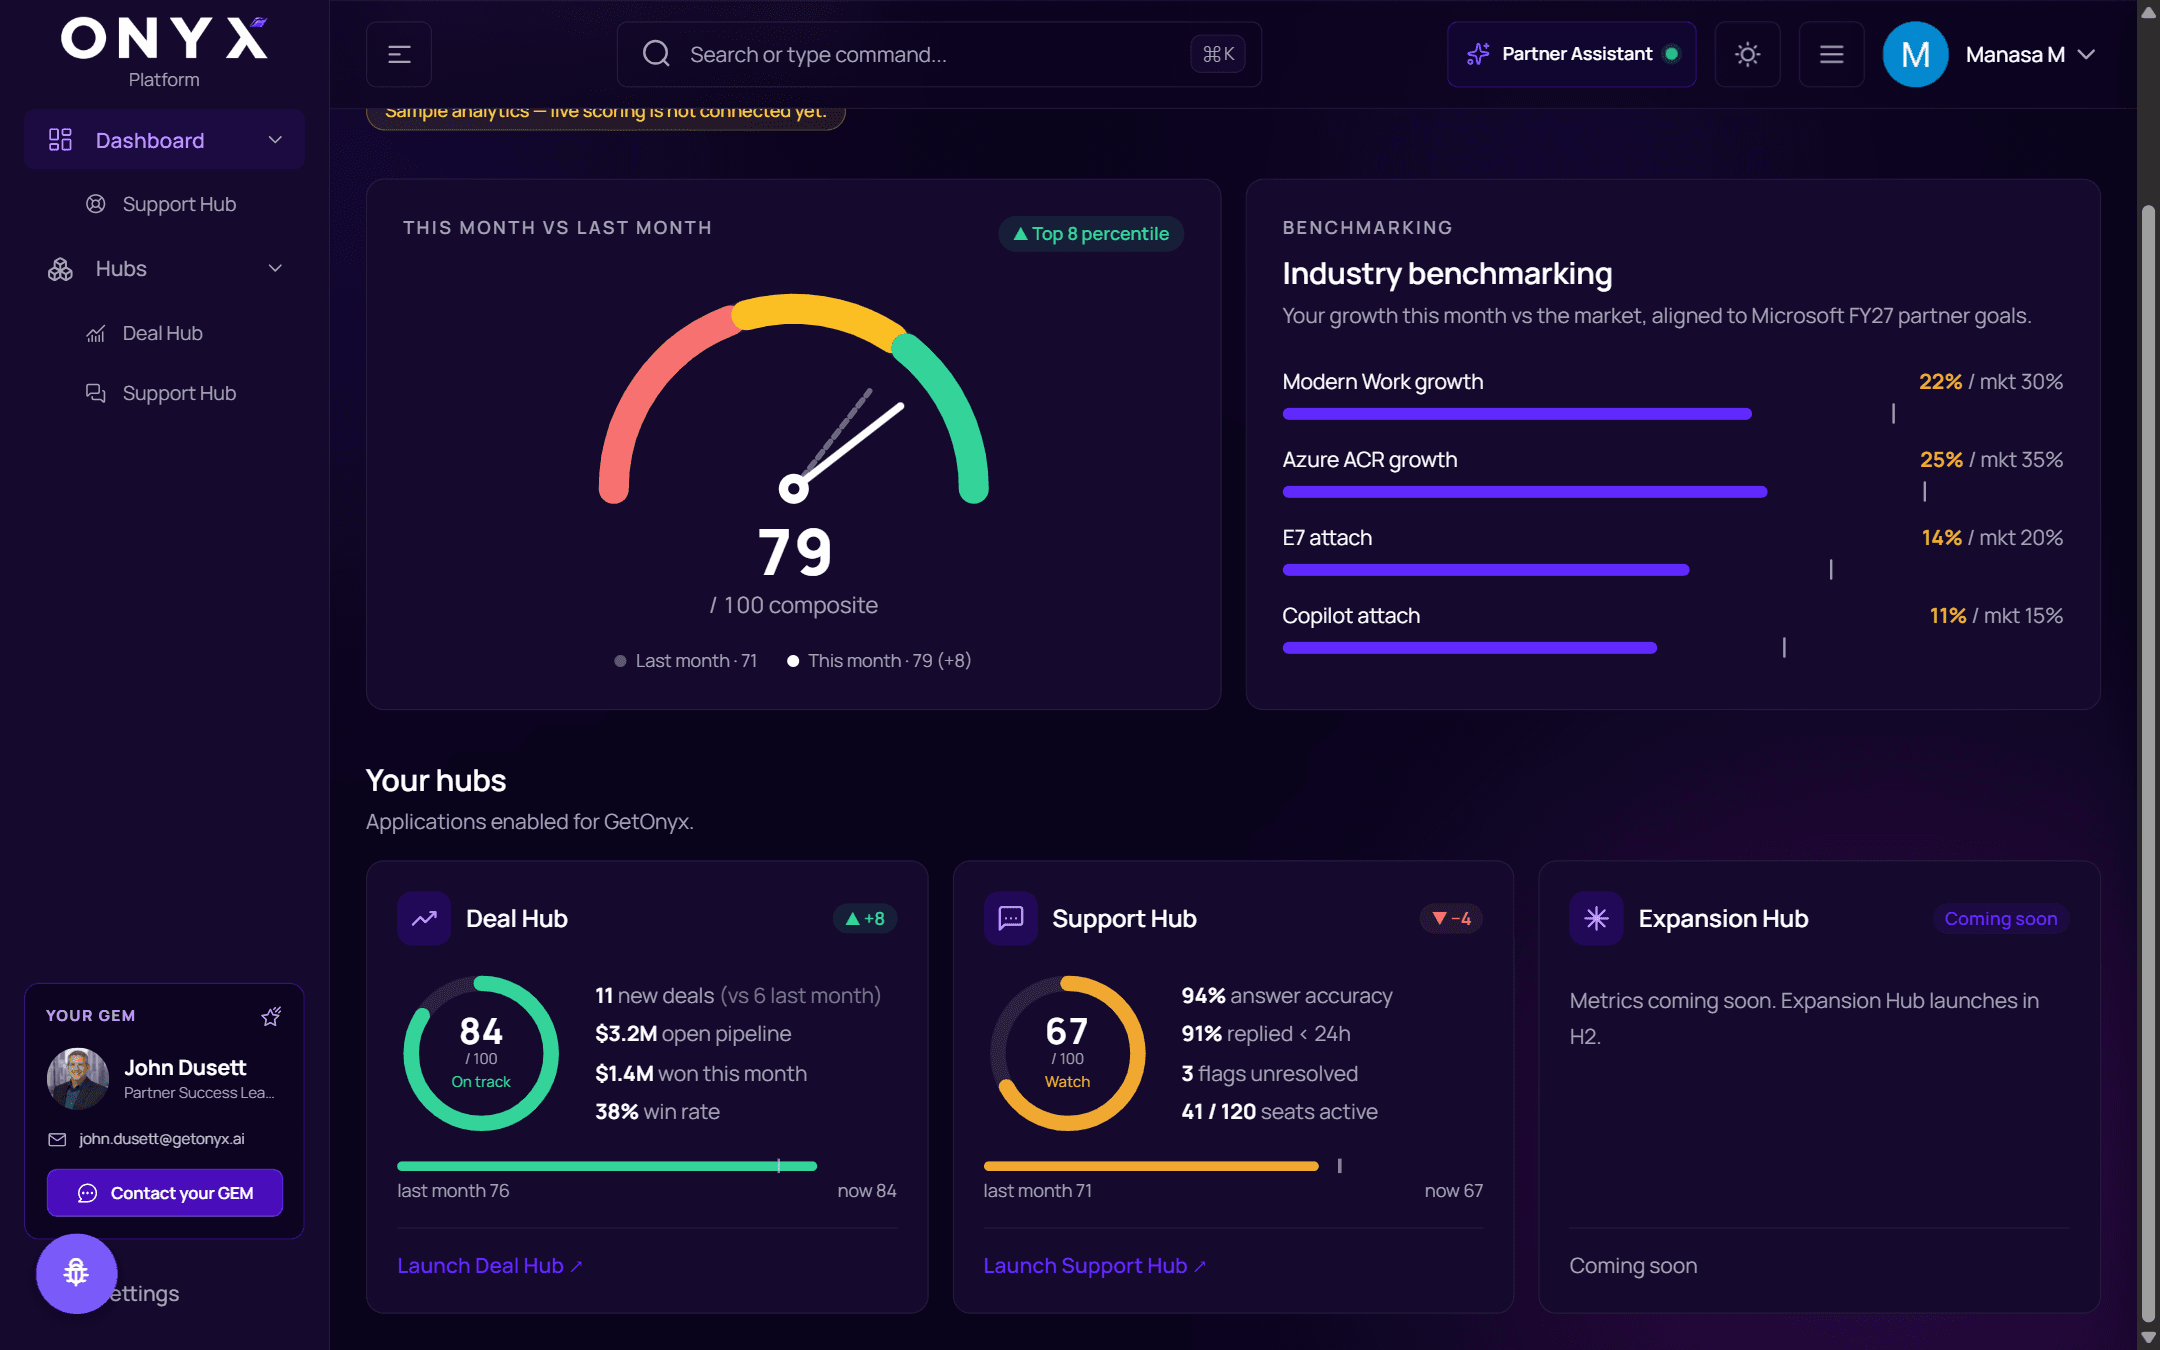
Click a hub's card to open it. A card can also show:
| Label | Meaning |
|---|---|
| Request access | The hub is enabled for your organisation but not assigned to you — ask for it |
| Request pending | You've asked; waiting for an administrator |
| Work in Progress | The hub is being rolled out gradually and isn't available to you yet |
| Not enabled for this organization | Your organisation doesn't have this hub |
| Coming soon | Not launched yet — for example Expansion Hub launches in H2 |
See Hubs for how requests work.